https://mg2a-my.sharepoint.com/personal/mging_mg2a_com/Documents/Martin%20Study&action=embedview
Test
Valuable Municipal Infrastructure
I have been becoming more and more interested in the cash value of our local roads, storm sewers, sanitary sewers, and water supply systems. This infrastructure is a huge asset owned and managed by local government. Infrastructure represent a significant chunk of our communities value and consumes a big chunk of our communities resources to maintain.
As a quick example,
My house is on a cul-de-sac that is about 800 feet long and 32 feet wide with concrete curb and gutter and 5 feet wide sidewalks. It is fair to say this road would cost over $150 per foot to build today. That means the road in front of my house had an initial value of about $120,000.
Typical suburban municipalities with about 15,000 residents might have 70 miles of local roadway. Those 70 miles are worth over $55 MILLION. Does that mean each home owner owns about $12,500 worth of roadway?!
The surface area of my road is about 3,000 square yards. Each time the road needs to be resurfaced a contractor grinds off and replaces about an inch of pavement. That is about 200 tons of grindings hauled off and 200 tons of new asphalt concrete placed for a cost of about $25,000. Most people would like to have their roads resurfaced every 10 to 15 years.
My cul-de-sac serves 9 homes. So the road cost about $13,300 per home to build and costs about an average of $225 per home each year just to keep the pavement surface in decent shape. That doesn’t include storm sewer maintenance, maintaining signs and lighting, the electric cost of lighting, road cleaning, snow plowing, pavement patching, fixing broken curb and sidewalk, or any major repairs.
To put this in perspective, the municipality I live in has a tax levy that represents about 5.5% of the total yearly property tax bill. That is $550 per year for a $10,000 tax bill. So, the municipality would have to use a little less than 1/2 of the total property tax I pay each year just to keep the pavement surface in front of my house in “good shape”. Can you say, “Not going to happen”?
Storm Water Detention vs Retention
Just a quick note about storm water detention or as we are calling it these days, “storm water control facility”. People often confuse the meaning of storm water “detention” and “retention”. They think a retention pond it is a storm water detention area that is always wet or looks like a pond.
True storm water retention is rarely used in Northern Illinois. A storm water retention facility captures storm water runoff and holds all or part of it until it infiltrates or evaporates or is used for irrigation. Storm water retention is a common practice in arid regions and locations with surface soils that allow water to enter quickly. These soils have a “high infiltration capacity”. Sand is an example of a high infiltration capacity soil.
Much of Northern Illinois has soils with high clay content near the surface. Clayey soils have a low infiltration capacity and may not be well suited for “retention” facilities. Other reasons much of Northern Illinois is not easily suited for storm water retention include a high water table during wet seasons and frozen ground during winter months. Storm water retention does have several potential benefits for Northern Illinois. These include recharging our drinking water aquifers, reducing the discharge of pollutants to our streams and reducing flood flows. These benefits may lead to future state and local storm water retention regulations.
So what do we call a storm water detention facility that always has water in it? It is often referred to as a “wet bottom storm water detention facility”. The three common types of storm water detention/control facilities in Northern Illinois are:
(1) Dry bottom (grass, concrete, and landscaping)
(2) Wet bottom (open water pond with dumped rock, grass, or landscaped banks)
(3) Wetland bottom (flat bottom holding a few inches of water with wetland vegetation)
Many storm water control facilities are a combination of all three types.
How big does that ditch have to be anyway?
That depends on how fast the water flows….
Engineers use a formula called “The Manning’s Equation” to calculate how fast water moves in a ditch. This formula also works for pipes when they are not flowing full.
Velocity = B x C x D
B is one divided by a number we find in charts that accounts for the roughness of the channel surface. It is commonly referred to as “Manning’s n”. Manning’s n for concrete is about .012. So the value of B for a concrete pipe or channel is 1/.012 or 83. Manning’s n gets higher the rougher the channel surface is; which results in a lower value for B. You know that. The smoother the surface….the faster the flow.
C is related to the “hydraulic radius” of the channel; which is the ratio of the channel surface to its area. You determine the “hydraulic radius” by dividing the length of water touching the channel by the area of the water. You know that. The channel bottom and sides drag on the water. The less water touching the channel; the faster it goes.
D is the square root of the slope. You know that. Steeper channels flow faster. However, that “square root” has a big impact. The square root of nine is three. So a channel nine times as steep only flows three times as fast.
And how much water you need to move…..
Engineer’s use a formula called the continuity equation to relate the amount of water flowing to the size of the channel and the velocity of the water in the channel.
Q = A x V
Q is “how much water you need to move” and is usually discussed in gallons per minute or cubic feet per second.
A is the area of the channel that is full of moving water. For example, if the channel is a rectangle, the area is the width of the channel times the depth of the water. The key to this value “A” is that it doesn’t matter how big the channel is; only how much of the channel actually has water in it.
V is the velocity of the water in the channel that we talked about earlier.
Recap
Most of this seems pretty obvious, doesn’t it?
Steeper ==> Faster
Smoother ==> Faster
Bigger ==> More
But, you have to keep in mind….
…..only the part of the ditch that is filled with moving water counts! Water in the bottom that does not drain out 100% when flow is stopped does not count. Digging a ditch deeper does not always help!
….shape matters. A ditch two feet wide and one foot deep can move more water than a ditch one foot wide and two feet deep. The area is the same but the water in the one foot wide ditch is touching 5 feet of channel and the water in the two feet wide ditch is only touching 3 feet of channel. What do you think is the most efficient shape for a channel? No engineers please.
These two versatile equations, Manning’s Equation and the Continuity Equation, are used to size swales on farm fields and back yards, estimate flood elevations in creeks, and determine what size storm sewer pipes are needed. Engineer’s use many equations that are what I call “very approximate”. These two equations are “very accurate” if you get the information right.
Let me know if you have any questions or would like to suggest a topic for discussion!
The Kankakee River Bypass Channel?
There is a nice slide show found at www.illinoisfloods.org discussing the construction of downstream steps on and a fish ladder and bypass channel around the Glen D. Palmer Dam in Yorkville, Illinois.
Are these life safety and recreational features that could be added to the Kankakee River dam in Kankakee, Illinois?
Good Steps
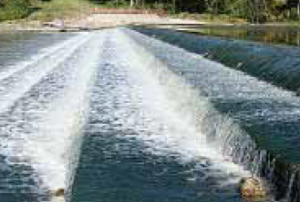
The steps were constructed to eliminate the dangerous hydraulic jump on the downstream end of the spillway. This is the condition you often see on the Kankakee River in Kankakee, Illinois on the downstream side of the dam. The hydraulic “jump” is where the water surface actually slopes back to the dam for a short distance. The jump creates a large trough where floating objects float and role until escaping down stream. The steps constructed on the dam on the Fox River in Yorkville allow river flows to cascade downstream eliminating the hydraulic jump or large trough on the downstream side for normal flow conditions.
The impact of these steps are dramatic. Drive by the Kankakee River dam in Kankakee sometime and compare the view pictured below. (I’ll add a photo later)
Jumping Fish
I will leave it to you anglers to watch the slide show to learn more details about the fish ladder design and construction. The fish ladder is a narrow concrete channel found on the north side of the dam. This structure allows fish to migrate upstream. Is this something that would be a benefit to anglers in our area?
Paddling Around the Kankakee River Dam?
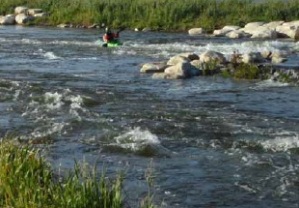
Paddlers can now run a 1/4 mile or so long “stream” with rapids and pools and drops around the dam on the Fox River in Yorkville, Illinois. The bypass channel – stream is a huge success and is enjoyed by novice and expert paddlers.
There is a linear park following the bypass channel with benches and standing areas to watch action on the water.
How exciting would it be to see people “shooting the rapids” in downtown Kankakee on a hot summer day? Or dropping a kayak in at Cobb Park and paddling to Bird Park?
Check out the Slide Show and let me know what you think.
Open Doors
Isla Mujeres has turned out to be a great place to plan and consider new adventures. There are suprises behind most doors here on the island! You just have to open the door and take a peak.
This has helped us with our planning for Open Channel Works. Sometimes you just can’t predict an outcome before you start!


